|
How To... > Work with Statistical Objects > Test Hypotheses > Test Slope
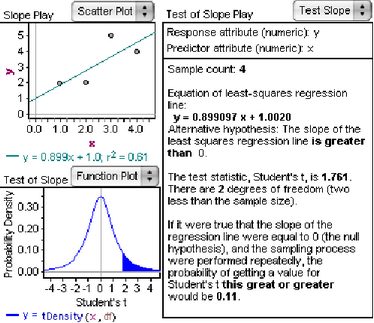
There are many approaches to investigations of a possible relationship between two numeric attributes. One question that can arise is whether the slope of the observed least-squares regression line is significantly different from zero. Shown below is an example “playground” that has a collection with only 4 cases. A scatter plot shows the value of attributes x and y, and a test slope object shows (in verbose mode) the determination of how likely the observed slope would be if there were no relationship between the two attributes.
| 1. | Create a hypothesis test object by dragging one from the or by choosing . |
| 2. | Choose from the test’s pop-up menu. |
| 3. | Drop numeric attributes on the prompt at the top of the test. |
A plot of the t-distribution shows the p-value as a shaded area. (Choose .)
Dragging the points around on the scatter plot to get a feel for what makes a slope significant can be quite instructive.
Note that this test requires raw data; that is, it cannot be used with summary data.
|