|
How To... > Work with Statistical Objects > Test Hypotheses > Test Mean from Raw Data (t-Test)
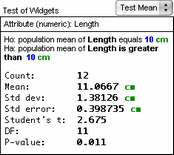
If you have a collection of numeric data (e.g., the lengths of widgets coming off an assembly line) and a hypothesis about the mean of these values (e.g., their average length has gotten above some threshold), you can use a hypothesis test object to determine how likely it is that your observed results can be explained by chance alone even if your hypothesis is not true (e.g., the mean length of widgets is at the threshold).
| 1. | Drag a hypothesis test from the or choose . |
| 2. | Choose from the test’s pop-up menu. |
| 3. | Drop the numeric attribute on the top line of the test. |
| 4. | Edit the default test mean to the desired value, and use the pop-up menu that lies under “is greater than” to choose the desired sense of the test. |
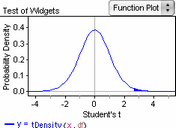
| 5. | If desired, choose to show the student’s t- distribution, with the area corresponding to the p-value shaded. |
|