|
Fathom Overview > Summary Tables
While graphs provide the most natural tools for exploring data, there are certainly times when you need to know one or more numerical results. Summary tables are a very flexible tool for organizing the numbers.
You can add attributes to both the rows and the columns of a summary table. This summary table has two numeric attributes as the rows and a single categorical attribute as a column. You can’t mix categorical and numeric attributes in the rows or columns. See Add or Remove a Summary Table’s Attributes.
|

|
Formulas appear below a summary table, and each cell of the table contains the results of those formulas for the cases that belong to that cell. You can add any number of formulas (see Add Formula). A menu command lets you quickly Add Basic Statistics or Add Five-Number Summary.
You can sort rows and columns in a summary table (Sort Categories in a Summary Table), and you can extract a summary table’s computed values into a collection, with one case for each cell in the summary table, attributes that describe the cell’s location, and one attribute for each formula (Create a Collection from the Cells of a Summary Table).
You can use a summary table as a calculator by adding a formula to it to do your calculation. You can link a collection to a summary table (by dragging the collection name to the summary table) and construct formulas that refer to attributes and measures in that collection.
|
|
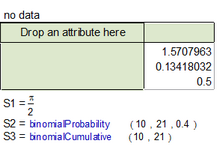
This summary table is being used as a calculator to calculate some values needed in the course of an investigation.
|


