Breakdown Plot


Breakdown Plot |
|
|
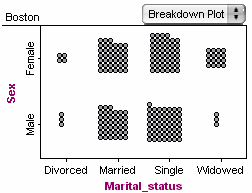
Fathom Reference > Graphs Available in Fathom > Graphs with Categorical Attributes on Both Axes > Breakdown Plot In a breakdown plot, each case is represented by a dot, placed in the “cell” representing the subgroup in which it belongs. •Drop a categorical attribute on each axis and choose Breakdown Plot from the graph’s pop-up menu.
|